Hydraulic Fracturing Engineering and Software Solution, for Your Most Challenging Reservoirs.
Changes – StimPlan™ 8.40
First Quarter 2023
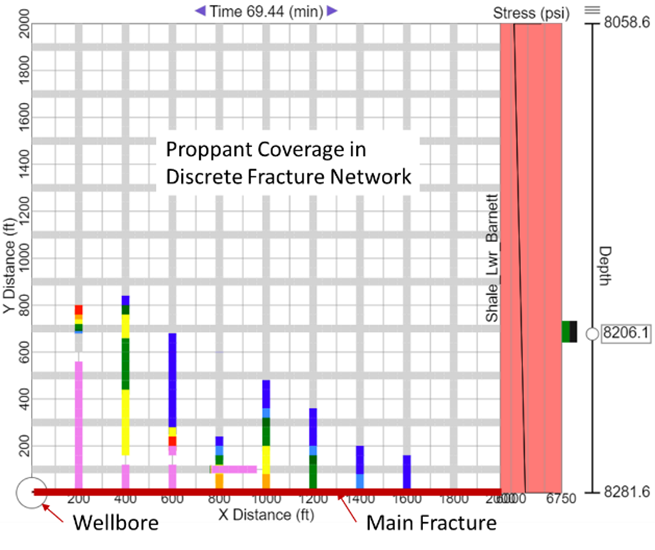
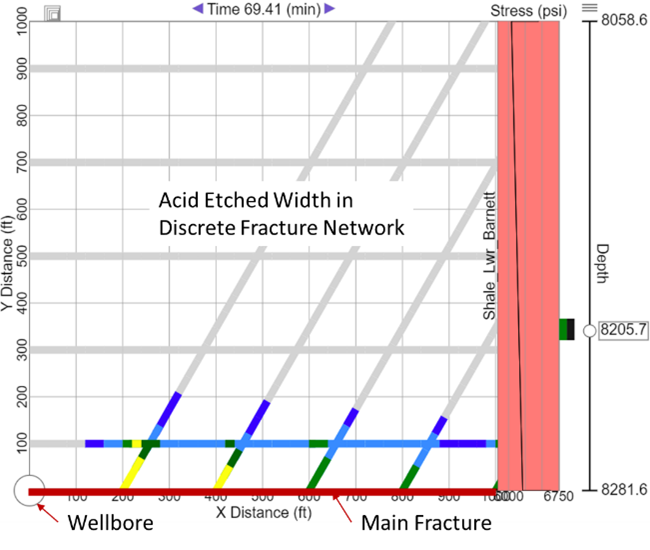
- Improve the Discrete Fracture Network (DFN) model. It models the proppant transport and acid reaction in both the main fracture and the DFN. The figures below show proppant coverage (left) and acid etched width (right) in DFN, respectively.
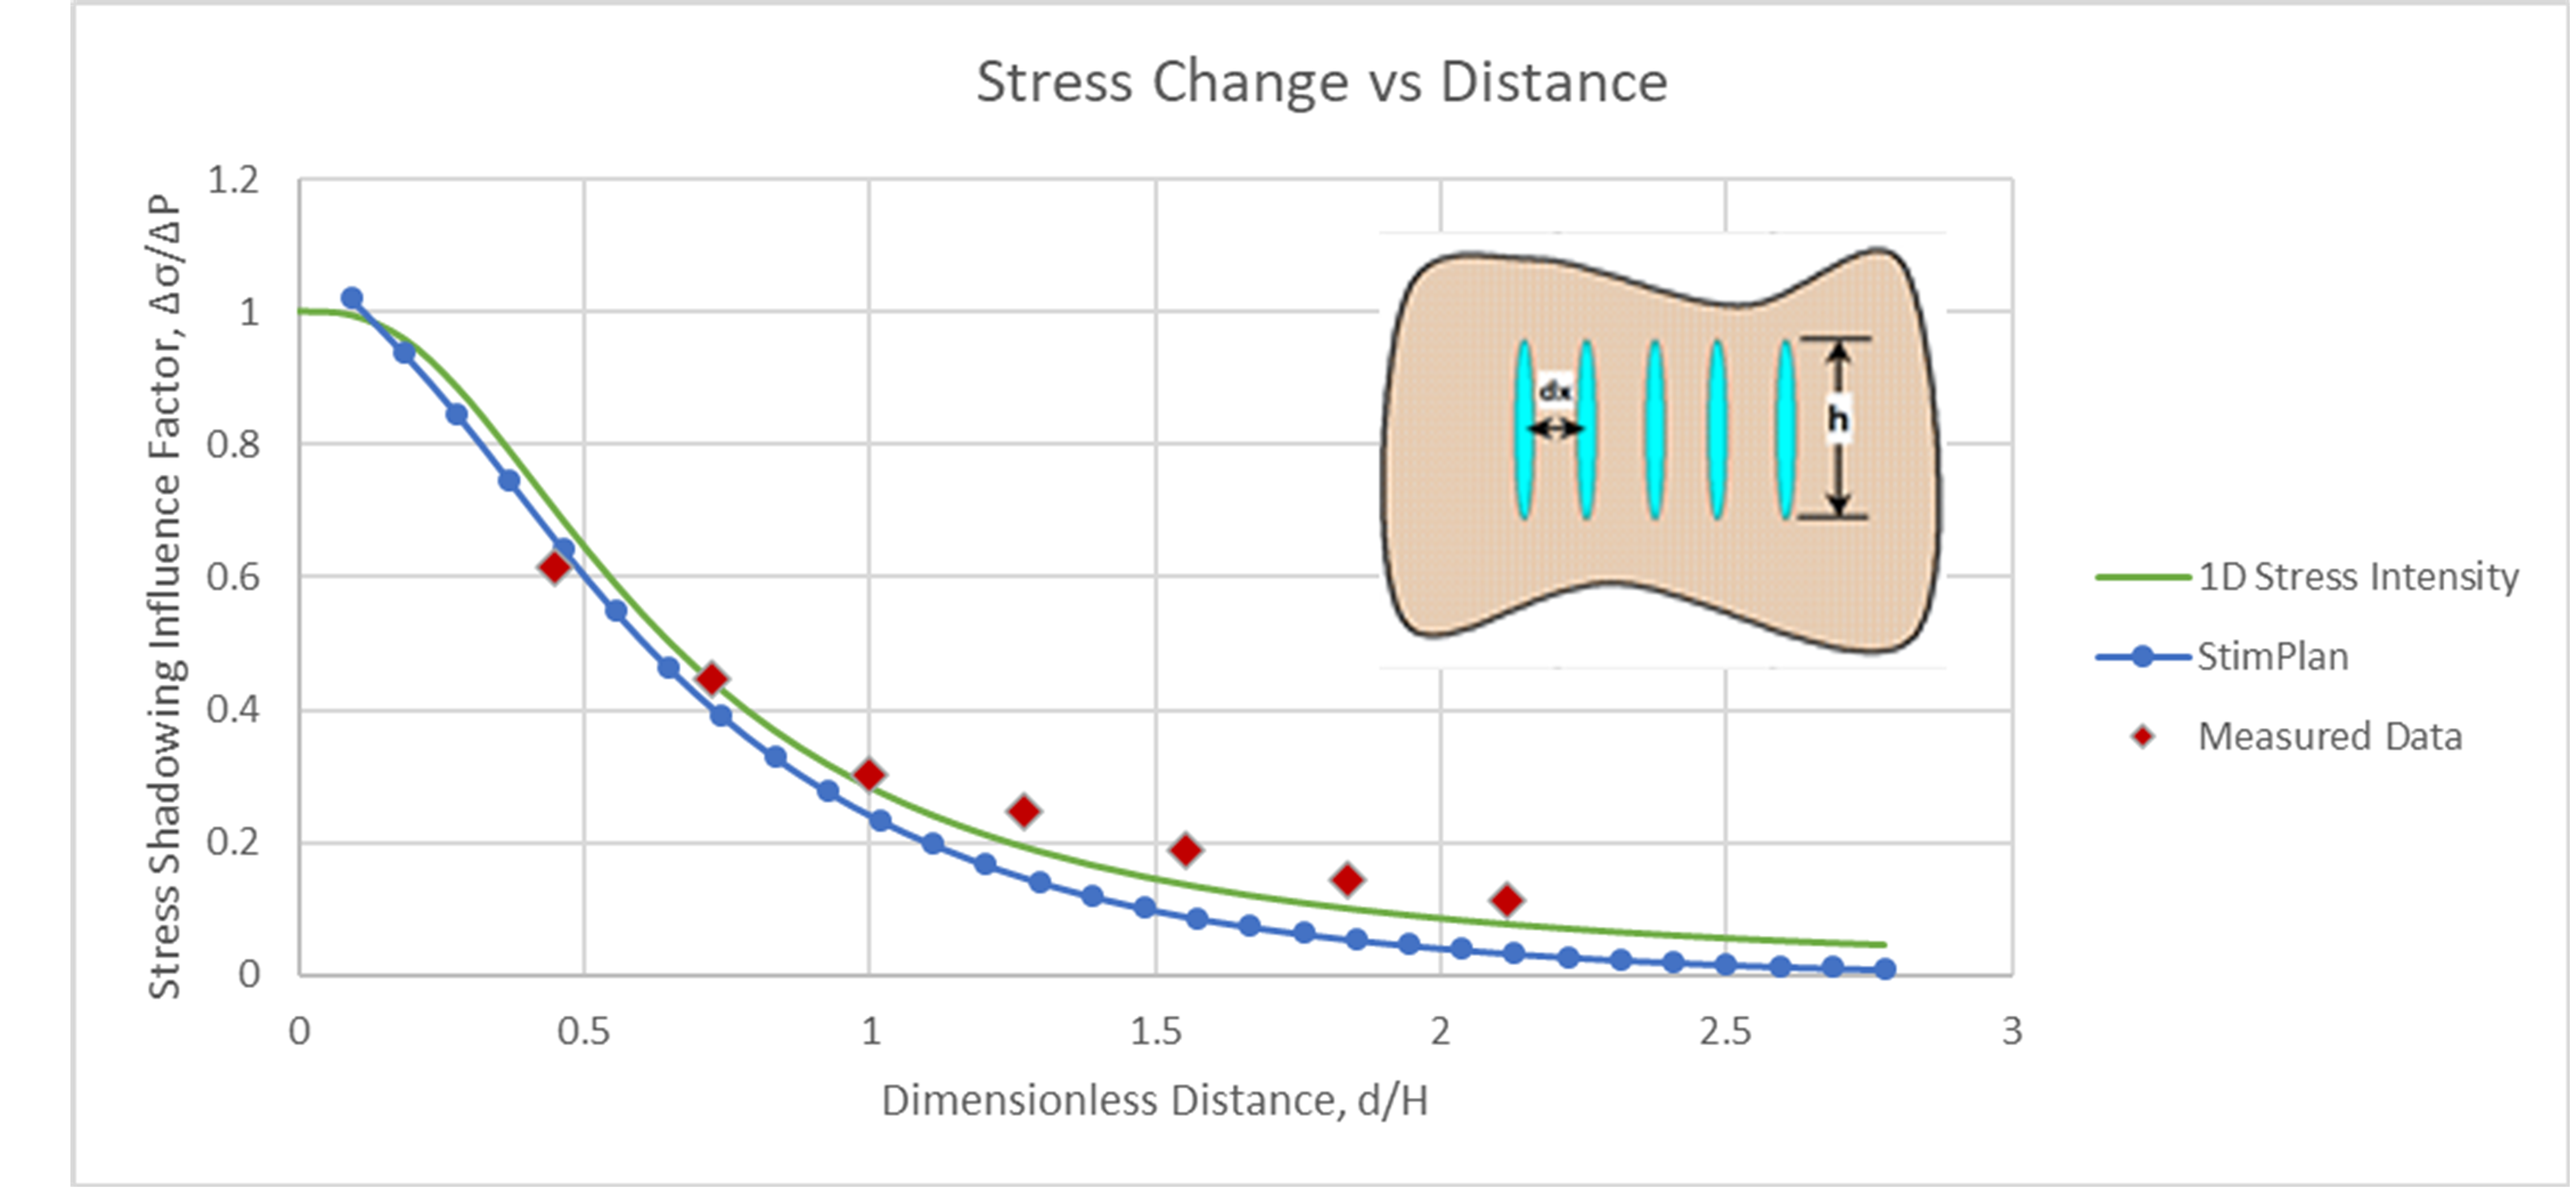
- Improve the stress shadowing model. We compare the StimPlan™ model with the data from SPE-209128. The green line in the figure is from the 1D Stress Intensity theory that is the simplified Sneddon model. The red line is the measured data from SPE paper. The blue line is the simulation result from StimPlan™. Compared to the measured data, the simulated result from StimPlan™ matches very well. It captures the main stress shadowing effect near the fracture. As the distance increases, the stress shadowing diminishes.
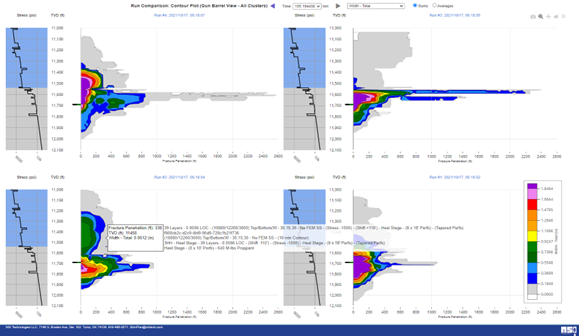
- Add the capability of contour plot comparison. For performing sensitivity studies & multivariate analysis, users can now visualize/compare their simulated treatment designs amongst multiple design scenarios side-by-side in a gun-barrel view.
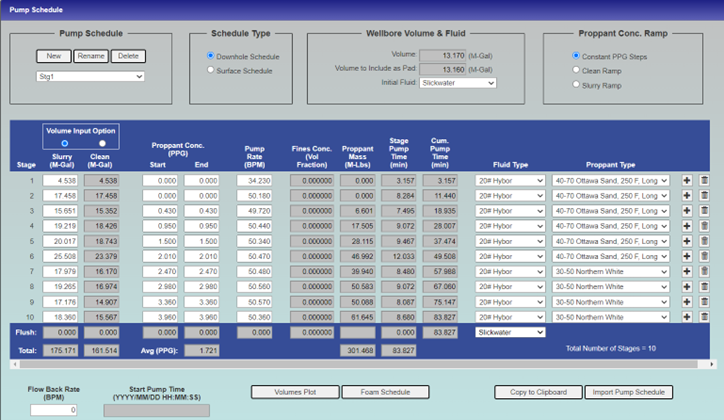
- Redesign the pump schedule page. Rearrange the layout. Reinvent the fill down, copy, and paste buttons. Improve user experience by adding tooltips, scroll bar, etc.
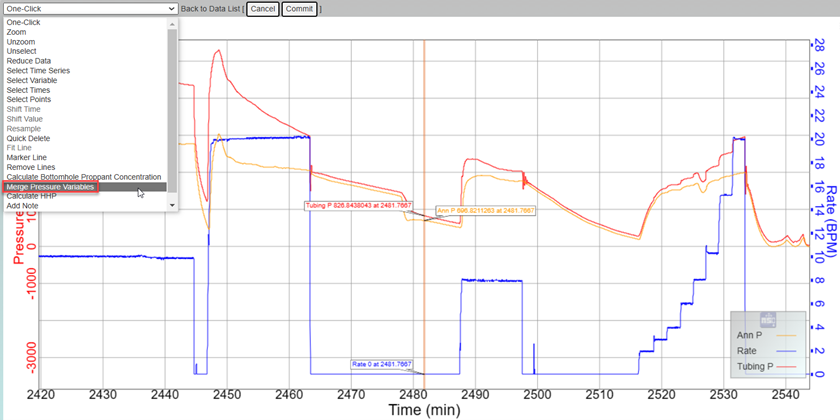
- Refine the functionalities in Data Plot of Pressure/Rate Analysis, including Reduce Data, Resample, Merge Pressure, etc.
- Accept more time formats imported into Pressure/Rate Analysis.
- Improve log import.
- Eliminate ghost runs for Cloud users due to insufficient capacity on the server.
- Updated help files.
