Hydraulic Fracturing Engineering and Software Solution, for Your Most Challenging Reservoirs.
Changes – StimPlan/E-StimPlan 5.50 April 2007
StimPlan
- “Geologic Models” – Added capability to save different “Geologic Models” (i.e., layer depths, stresses, modulus values, fluid loss, perforated depths, etc.) in a single STP file.
- Automatic Tip screenout (TSO) treatment designs. The user inputs the desired propped fracture length, and the desired proppant coverage (lb/ft2) subject to a maximum net pressure rise. StimPlan then automatically generates the required pump schedule (which can then be adjusted as desired by the user).
- Production Model – Added the ability to simulate a wellbore “skin” for horizontal well production modeling.
- Automatic PNet History Matching. This automatically runs cases and determines the best history match.
- Folds-of-Increase. This calculation was totally revamped to provide: a) rigorous inclusion of boundary effects, and b) the near wellbore Δp associated with frac-packs.
- Predicted Surface Pressure – Added capability to allow different pipe friction for different sections of the wellbore when calculating the “Predicted Surface Pressure”
- Added a “PI” plot for the Production Model output.
- Further expanded the “Report” format output with direct, formatted output to WORD and/or EXCEL.
E-StimPlan
- MAJOR DEVELOPMENT – Horizontal (High Angle) Well Fracturing – This significantly upgrades the ability to simulate fracturing horizontal wells including longitudinal fractures (where the fracture communicates with additional perforations or wellbore as it propagates) and multiple, simultaneous transverse fractures. This includes:
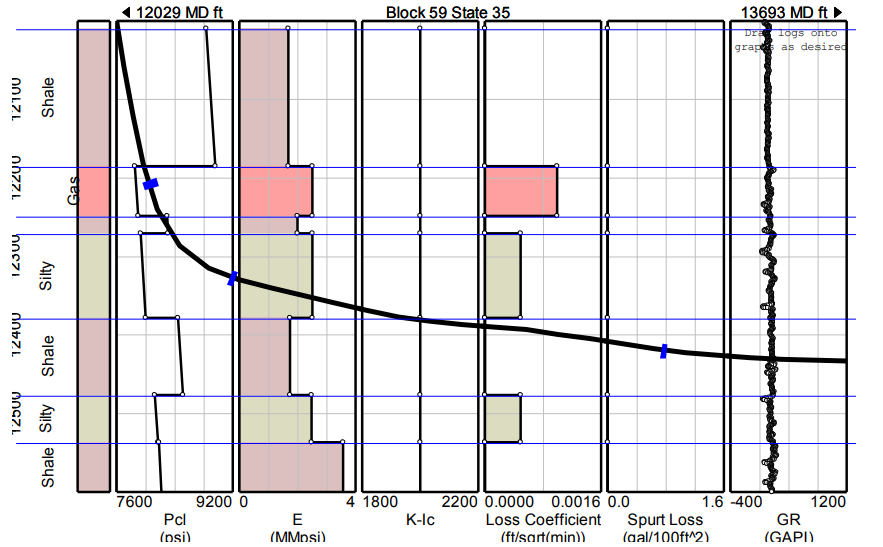
> Input – Special input formats (with one example included in the figure) for entering & visualizing data for high angle wells, and
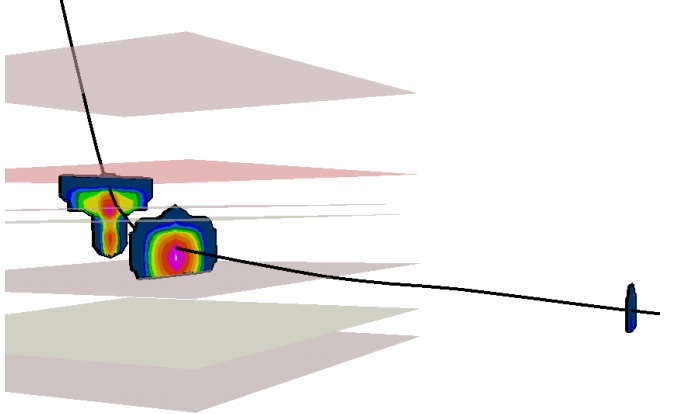
> Output – Special 3D output for visualizing multiple fractured horizontal wells, and the relation between fractures (as seen in the figure). - Expanded Batch Mode Capability – The rigorous E-StimPlan Fully 3D simulations can be time consuming for some applications. This new feature allows creating a “task list” of runs. These are then executed over-night, with the results automatically archived at the completion of each simulation.


Analysis/Logs Modules
- After Closure Analysis (ACA) – Further the “ACA for permeability” analysis to include a Type Curve Analysis for reservoir pressure. This allows reservoir pressure/permeability determination with shorter shut-in times.
- Added log calculations for integrating density logs for OB.
- “DConc” Variables – To analyze an actual propped fracture treatment, StimPlan historically uses a “SConc” variable (surface proppant concentration) and shifts that data to a “Downhole Concentration (DConc) variable. This is done the “Frac Job Test Analysis”. Two changes were made: > Data Plot – Surface Proppant Concentration data can be shifted to a Downhole Concentration in the Data Plot, and > External DConc Variable – The Frac Job Test Analysis can be done using an external calculated downhole concentration that has been imported.
- Use “Other” Variables for Frac Job Test Analysis – In the analysis of a “frac Job”, the data is broken into stages for simulation. This is historically done based on pump rate/proppant concentration changes. Ability has been added to add stage changes based on other variables – maybe such as chemical concentration changes which would indicate a change in fluid rheology.
- Log Output – Added a continuous, scaled log output to PDF files for printing a continuous log.
- Calculate Log Stress – Added graphical input capability for reservoir pressure distribution for stress log calculations.
- Calculated Bottomhole Pressure – Added capabilities to 1) allow different pipe friction for different sections of the wellbore and 2) specify different fluids (with different friction properties) at different times when calculating a “Calculated Bottomhole Pressure”
- Data “ReSample” – The process where two variables are “combined” in the Data Plot, i.e., where a memory gauge Bottomhole Pressure may be combined with surface data was dramatically speeded up. This has always been a good, popular StimPlan feature, but we were seeing more and more cases of HUGE data sets, and this process sometimes took a few minutes (prompting an occasional decision to “kill” the program where users thought it was hung or something). This process ahs been dramatically improved to avoid this perceived problem.
- Plot Coordinate Display – StimPlan has always had a user selectable option to display the cursor coordinates on any plot, but this facility has been significantly improved and speeded up.
